이제 중요한 한가지 이야기를 해야 할 때가 된 것 같다. 바로 앞서 지난 100년간 지구의 온도가 평균 섭씨 0.74 ± 0.18 도 상승했다는 믿을 만한 근거들을 제시했다. 그렇다면 정말 그것이 인간의 영향으로 인한 것인가? 오늘날 상당수의 주류 과학자들이 그렇게 믿고 있다. 그들이 그렇게 믿는 근거는 무엇인지 간단히 말해볼 생각이다.
그 이유는 현재 일어나는 기후 변화와 온난화 경향의 주 원인이 인간 때문이 아니라는 반론을 제기하는 의견도 있기 때문이다. 이러한 의견은 현재 과학계에서는 주류라고 보기는 어려우며 소수 의견이라는 점을 앞서 이야기한 바 있다.
사실 이러한 의견의 차이는 과학계에서는 드문 일이 아니다. 과거 파스퇴르가 생명의 자연 발생설을 부정했을 때 그의 의견이 결국 과학계의 주류가 되기는 했지만 반대파들이 모두 사라지고 정설로 굳어지기 까지는 상당한 시간이 필요했다. 지금의 빅뱅 이론도 정상 우주 모델과의 경쟁을 통해 상당한 시간이 흐른 후에야 주도적인 이론으로 굳어졌다.
필자가 생각하기에 인간의 활동에 의한 기후 변화 역시 이러한 과정을 거쳐야 하며, 그 전에 모든 형태의 과학적 비판을 받아야할 충분한 이유가 있다. 과학에서는 믿음이 아니라 의심이 미덕이 되는 영역이기 때문이다. 제기되는 모든 의심점을 해결하고 난 이후 이 이론을 믿을 수 밖에 없는 근거들이 제시되었을 때 비로소 과학적 정설이 될 수 있다.
이런 관점에서 볼 때 왜 지금의 지구 기온 상승이 왜 인간 때문이고, 앞으로는 이 문제가 더 심각해지리라고 믿는지 간단히 짚고 넘어갈 필요가 있을 것이다.
1. 과거 지구의 온도는 어떻게 변해 왔는가 ?
이 이야기를 하기에 앞서 지구의 온도를 변화시키는 힘에 대해서 간략히 이야기 해야 할 것이다. 여기서 그 메카니즘을 다 설명하기는 어렵겠지만 앞으로의 이야기를 진행하기 위해 간단한 설명이 필요할 것이다.
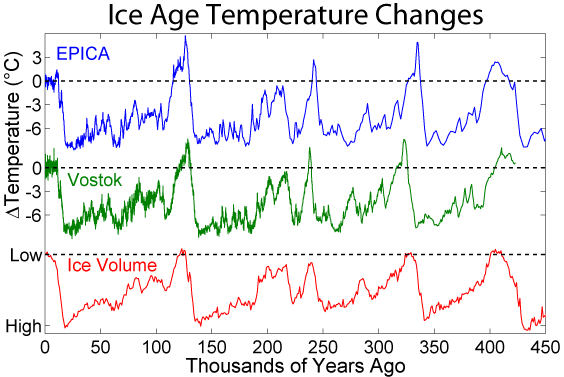
앞서 이야기 했듯이 지구는 지난 50만년간 약 10만년 주기로 빙하기와 간빙기가 교차하면서 기후가 변화해 왔다. 빙하기와 간빙기 사이에는 대략 섭씨 5도 정도 온도의 차이가 있게 되는데 오늘날 인류는 빙하기에서 온화해진 기후에 살고 있다.
(지난 45만년간의 온도 데이터 CCL 에 따라 동일 조건하 복사 허용, 저자 표시, 상업적 이용 금지 This figure was originally prepared by Robert A. Rohde from publicly available data and is incorporated into the Global Warming Art project)
지구의 온도에 이와 같은 변동을 일으키는 요인은 대기의 구성 성분의 차이로 인한 온실 효과의 차이 (즉 온실가스가 적으냐 많으냐는 것, 그리고 냉실 효과도 포함될 것이다), 대륙이 이동하므로써 생기는 대륙의 분포의 차이와 이로 인한 빙하 및 알베도의 차이 (즉 태양 빛을 반사하는 정도), 그리고 밀란코비치 사이클 이라 불리는 지구 자전축의 변화 및 지구 공전 궤도의 이심률의 차이, 그리고 태양에너지의 주기적 변화 등이 그 이유가 된다. ( http://100.naver.com/100.nhn?docid=82398 ) 이외에도 거대한 운석 충돌이나 화산활동등도 변동의 원인이 될 수 있다. 이들을 간단히 살펴보겠다.
2. 온실 효과
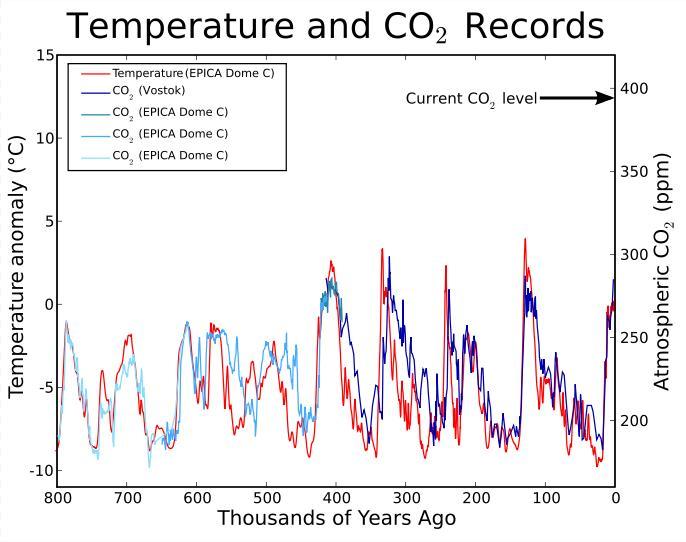
: 온실 효과를 일으키는 기체들의 농도의 차이는 지구 온도에 직접적인 영향을 미칠 수 있다. 대표적으로 이산화탄소와 메탄 등이 그 주역이라고 할 수 있다. 수증기의 온실효과가 가장 크지만 결국 이는 이차적으로 온도가 높아지면서 발생하는 것이기 때문에 일단 일차적인 원인이라면 이산화탄소 및 메탄이 가장 큰 주역이 된다. 특히 대기 중 이산화탄소 농도는 지구의 기온과 매우 밀접한 관계가 있다. 이산화탄소 농도와 지구의 기온은 거의 같이 증가하고 감소한다.
(지난 80만년간의 대기 중 CO2 농도 및 지구의 기온 변화를 나타낸 그래프. 현재의 이산화 탄소 농도는 지난 80만년간과 비교해도 평균을 한참 벗어난 상태다. CCL 에 따라 동일 조건하 복사 허용, 저자 표시 This figure was produced byLeland McInnes using python and matplotlib and is licensed under the GFDL. All data is from publicly available sources.
또 온도 상승 자체가 대기 중 CO2 농도를 높일 수 도 있다. 이 부분에 대해서는 다음에 별도로 이야기할 생각인데, 인간이 지구의 온도를 높이면 결국에는 양성 되먹임 (Positive feedback) 에 의해 대기중 온실 가스 농도가 더 늘어나 더 심각한 온실 효과를 일으킬 가능성이 있기 때문이다.
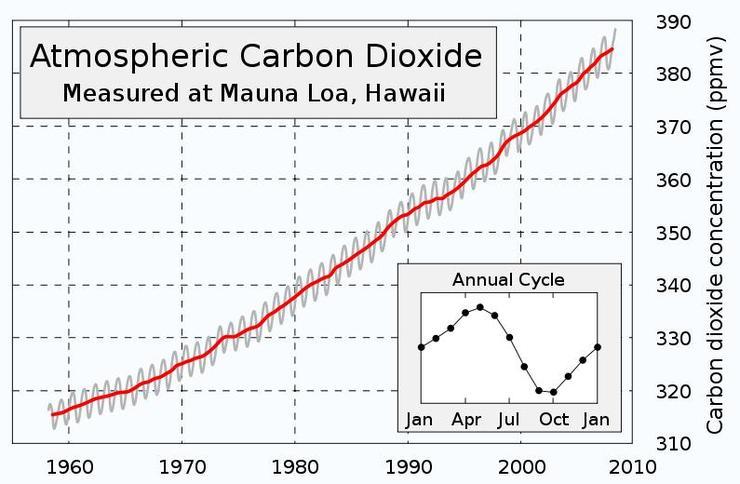
그러나 어떻게 생각해 보더라도 현재의 대기 중 이산화탄소 농도는 자연적이라고 생각하기가 어렵다. 대개 지난 50만년 이상동안 빙하기에는 180 - 210 ppm, 간빙기에는 280 - 300 ppm 수준을 벋어나지 못하던 대기중 이산화탄소 농도가 지금은 무려 380 ppm 을 넘어 현재 400 ppm 을 향해 매년 2ppm 정도 증가 중에 있기 때문이다. (아래 도표 참조)
따라서 우리가 가진 과학적 지식을 생각할 때 이렇게 증가된 이산화탄소 농도는 보다 큰 온실 효과를 일으켜서 지구의 기온을 상승시킬 것이다. 만약 증가된 이산화탄소 농도가 온도 상승을 일으키지 않는다면 현재 우리의 물리학, 지구 과학에 대한 지식이 잘못된 것임이 틀림없기 때문이다.
그리고 이산화탄소 농도가 최소한 50만년 이내로 이렇게 크게 증가한 것은 자연적인 이유로 보기 힘든데, 그냥 위의 그래프들을 보더라도 최근 50만년 사이에는 이렇게 크게 증가한 적이 없기 때문이다. 따라서 어딘가 다른 데서 이산화탄소가 유입된 것이라는 자연스러운 결론을 도출할 수 있다.
마지막으로 우리가 알기로 인간은 해마다 수백억톤의 이산화탄소를 대기중으로 내보내고 있다. 비록 이들 중 상당수가 바다와 토양에 저장되기는 하지만 전부가 그렇게 될 수는 없다. 사실 대기중의 이산화탄소가 모두 토양과 바다로 흡수된다면 지구는 빙하기 때보다 기온이 더 떨어질 테니 이것은 다행이라고 할 수도 있다. 아무튼 과학자들은 인간이 배출한 이산화탄소 중 상당수가 아직 대기 중에 있다는 것을 알고 있다.
따라서 최근의 이산화탄소 증가가 인간의 활동 - 특히 화석연료 사용 - 에 의한 것이고, 이것이 지구의 온도를 상승시키고 있다는 결론은 타당한 결론이라고 하겠다.
만약 이를 부정하려면 이산화탄소가 온실효과를 일으키지 않던가 - 그러나 그러면 지구의 평균 기온은 지금보다 엄청나게 떨어져야 한다 - 아니면 인간이 대기중으로 매년 수백억 톤의 이산화탄소를 내보내는데, 이것이 어떤 알 수없는 이유로 모두 제거되고 다시 누군가가 어떤 이유에서인지 과학자들 몰래 이산화탄소를 대기중에 내뿜고 있다는 이상한 결론에 도달해야 한다. 그래야 인간이 대기중으로 엄청난 이산화탄소를 내뿜고 있는데도 인간의 활동이 대기중 이산화탄소 농도 증가와 관련이 없다고 이야기 할 수 있을 것이다.
이것은 오염된 폐수를 엄청나게 방류하는 한 회사가 주변 하천이 오염된 것은 우리가 버린 폐수와는 상관이 없으며 다른 자연적인 원인이 있다고 주장하는 것과 같다. 오염 물질과 버린 폐수 (이 경우는 이산화탄소) 가 일치하는데도 말이다. 보다 이성적인 설명은 오염된 폐수가 하천을 오염시킨 원인이라고 설명하는 경우일 것이다.
3. 대륙과 지각판의 이동
지구의 대륙은 끊임없이 조금씩 이동한다. 이에 따라 바람과 해류의 이동을 미쳐 지구 기후에 영향을 미친다. 그리고 태양 에너지를 반사키는 알베도나 대륙 빙하가 형성되는 과정에 큰 영향을 미칠 수 밖에 없다. 그러나 이 변동은 그냥 상식적으로 생각해도 수백 - 수천만년의 세월이 걸리기 때문에 (즉 대륙이 지난 100년간 기후 변동을 일으킬 만큼 이동 하지 않았다는 이야기다) 이에 대해서는 설명을 생략한다. 대륙의 분포는 지난 100년간 온도 변화를 설명할 수 없다.
4. 지구의 자전 및 공전이 미치는 영향
지구와 태양과의 관계도 온도 변화를 일으킬 수 있다. 이는 지구의 공전 궤도 및 자전 축과 태양과의 관계에 의한 것이다. 최근 지구 기후에서 10만년 주기로 간빙기와 빙하기가 나타난 것은 세르비아의 수학자 밀루틴 밀란코비치가 주장한 밀란코비치 사이클 (Milankovitch cycles) 과 연관이 깊다.
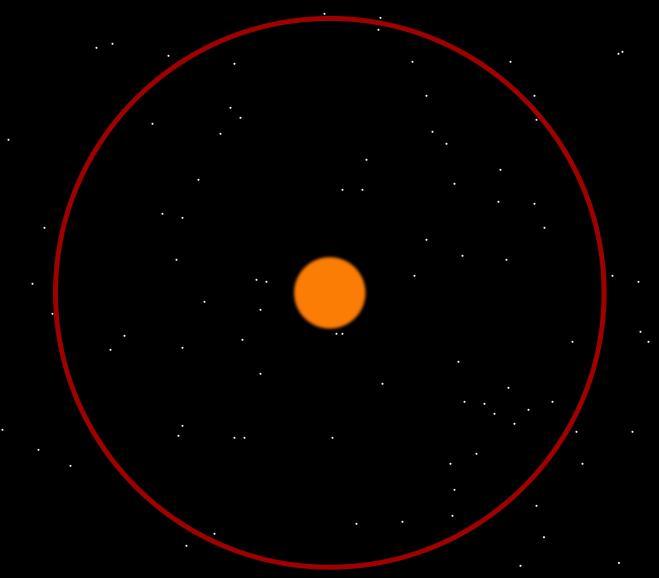
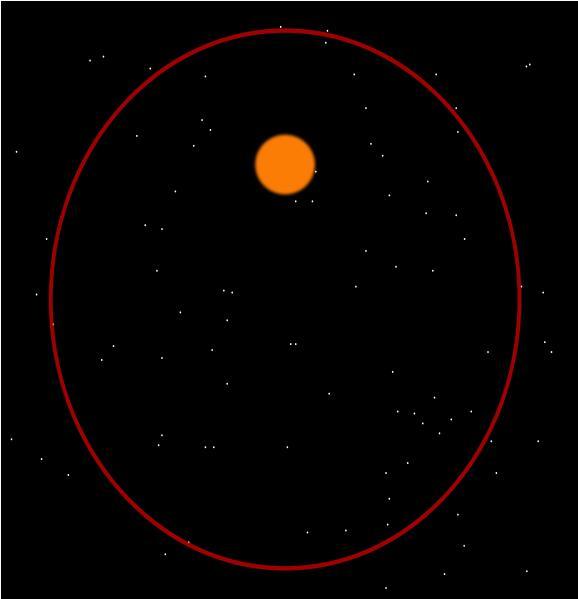
이 이론에 따르면 지구의 공전궤도의 이심률은 평균 10만년을 주기로 변동한다. 지구 공전궤도가 완전한 원에 더 가까운지, 아니면 다소 타원에 가까운지에 따라 계절마다 받는 태양에너지의 양이 차이가 나게되는데, 타원 궤도가 커져서 지구가 태양에서 많이 멀어지는 경우에는 지구의 온도가 떨어져 기온이 떨어지게 된다.
(지구 공전 궤도가 거의 원궤도에 가까울 때 (위) 와 이심률이 커진 궤도 일 때(하)의 차이. 이 그림은 다소 과장해서 그린 것이다.This file is in the public domain because it was created by NASA)
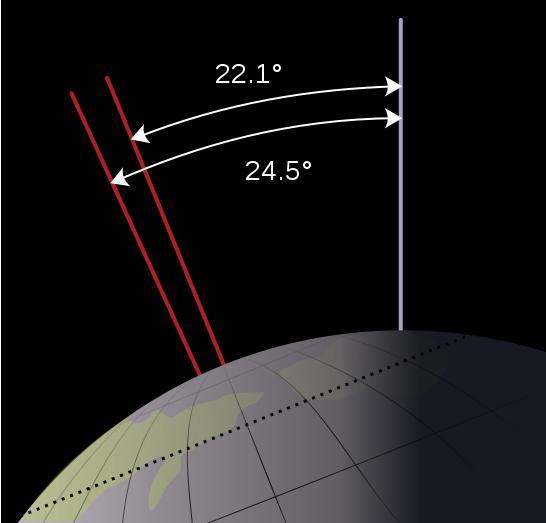
여기에 지구 자전 축도 41000년을 주기로 22.1° 에서 24.5° 로 변하는데 이것도 태양에너지를 받는 각도를 변화시켜 지구의 온도에 영향을 줄 수 있다.
(지구 자전축은 41000년을 주기로 기울기가 변한다. This file is in the public domain because it was created by NASA)
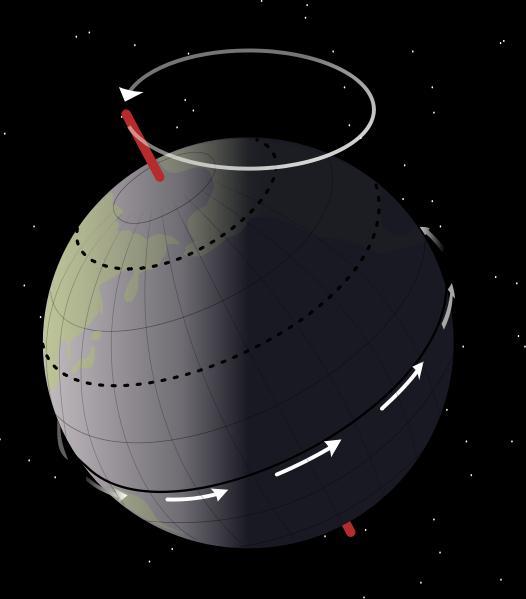
또 지구 자전축 자체가 한바퀴 원운동을 하는데 이것이 북극성이 세월에 따라 변하는 원인이다. 이 주기는 약 26000년 이다. (아래 그림)
그러나 이미 눈치챈 분도 있겠지만 이러한 밀란코비치 사이클은 10만년 주기의 빙하기와 간빙기를 설명하기에는 적당하지만 지난 100년간의 온도 상승을 설명하기엔 부적합하다. 지구 공전 궤도의 이심률이나 자전축은 몇만년 단위로 의미있게 변동하지 100년도 안되는 시간이내로 크게 변할 수 는 없다.
5. 태양의 변동
태양에서 지구로 전달되는 에너지야 말로 지구의 기온을 결정하는 가장 직접적인 요소라고 할 수 있다. 그러나 태양에서 뿜어져 나오는 에너지의 양은 대개 일정하긴 하지만 그래도 다소 변동이 있을 수 있다. 그리고 이러한 도달하는 에너지의 차이는 결국 온도의 차이를 만들어 낼 수 있다.
과학자들은 중세 온난기 (Medieval Warm Period) 같은 경우가 바로 이런 영향을 받은 경우로 생각하고 있다. 이 중세 온난기에 유럽에서 농업 생산이 증가하여 고도 중세시기로 넘어가고 그린란드에서는 바이킹 식민지가 건설되었다.
사실 태양 에너지의 변동은 지구에서 다행히 현재 측정이 그렇게 어렵지 않다. 과학자들은 간접적인 방법으로 과거 태양 복사의 변동을 추적해서 이것이 기후에 미치는 영향을 알고 있다.
결론적으로 말하면 이런 태양 복사 에너지의 변동을 포함 모든 자연적인 원인들을 고려하면 1950년대 이전에는 어느 정도 기온 상승을 설명할 수 있다. 그러나 1950년 이후 현재의 기온 상승을 설명하기에는 매우 불충분하다. 아래의 그래프를 보자.
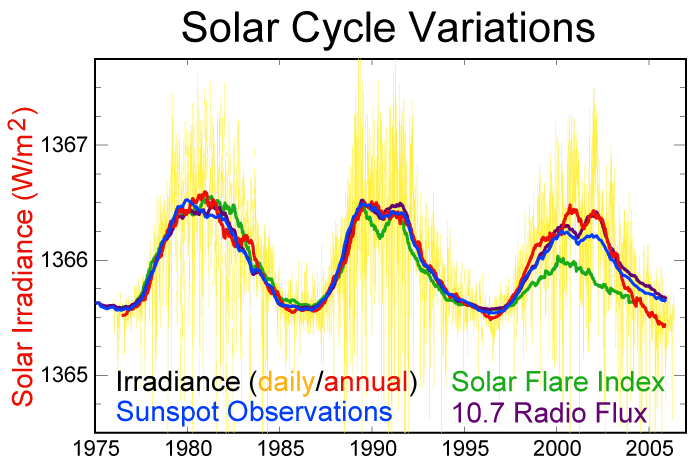
(지난 30년간의 태양의 에너지 및 흑점, 플레어 주기 CCL 에 따라 동일 조건하 복사 허용, 저자 표시 This image was created by Robert A. Rohde from the published data listed below and replaces an image created by William M. Connolley. It is part of the Global Warming Art project
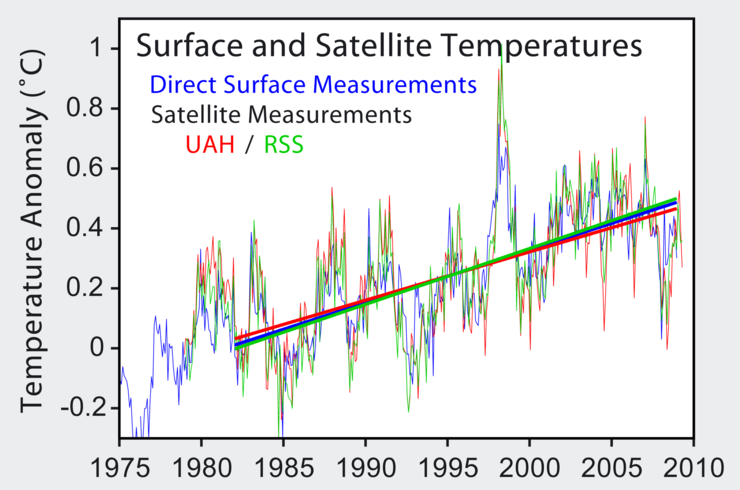
지난 30년간의 그래프를 본다면 주기적 변화는 있지만 2005년의 온도는 1975년 수준의 온도와 비슷해야 한다. 그러나 현실은 다르다. 아래의 그래프를 비교해 보자.
(앞에서도 본 지구의 평균 기온 변화 파란색은 지상 온도 관측 결과이다. ( http://en.wikipedia.org/wiki/Milankovitch_cycles ) 두개의 위성 관측 결과가 비교되었다. 빨간색은 UAH 팀이며 초록색은 RSS 팀이다. CCL 에 따라 동일 조건하 복사 허용, 저자 표시, 상업적 이용 금지 This figure was originally prepared by Robert A. Rohde from publicly available data and is incorporated into the Global Warming Art project)
최근 30년간의 태양 주기와 지구의 평균 기온 변화는 별 상관관계가 없어 보인다. 오히려 최근에는 태양의 활동이 다소 감소하는 추세이기도 하다. 그러나 온도는 여전히 과거로 돌아가지 않고 있다.
사실 태양의 활동도 중요하게 관측할 요소이기는 하다. 태양 활동이 앞으로 감소한다면 지구 온난화는 다소 덜해질 테고, 다시 활동이 활발해지면 현재의 지구 온난화를 더 심하게 만들 수 있기 때문이다.
아주 간략한 설명 - 물론 필자의 지식이 부족해서이다 - 이지만 그래도 왜 지구 기온의 상승, 특히 20세기 후반의 기온 상승이 자연적인 이유가 아닌 인간의 활동에 의한 것인지를 설명해 보았다.
물론 과학적인 데이터를 두고 과학자 사이의 논란이 있을 수 있음은 자명하다. 그러나 현재 주류의견은 지구의 기온이 오르고 있으며 이는 인간의 활동 때문이란 것이다.
더군다나 앞으로 기온이 더 오를 것이라는 예측은 충분한 근거가 있는 걱정이다. 앞으로 이부분에 대해서도 간략히 설명해 보겠다.
(일러두기 : 최근 저작권 문제와 관련하여 새롭게 포스트에 표시를 하려 합니다. 이 포스트의 사진과 이미지들 중 public domain의 표시가 있는 것은 자유롭게 사용이 가능하도록 공개된 것이나 발표된 지 오래되어 저작권이 소멸된 것 들입니다. 이를 복사해서 사용하는 것은 저작권법에 위반되지 않습니다. 단 원저작자 표시가 있고, 이를 표시할 의무를 지정할 경우 이에 따라야 합니다.)